Back Office Reports
Reports allow you to view your basic data from your business in real-time with easy to read charts and tables. If you are looking for advanced analytics, then you should talk to us about Kounta Insights. Kounta Insights allows you to access a library of pre-built reports to quickly identify opportunities to control costs and grow revenue. Your data is displayed in beautiful, interactive visualisations that help tell the complete story, and can be broadcasted to your team to keep them in the know, motivated, and on track. See something that catches your eye? Kounta Insights lets you dig deep beneath the surface to drill into areas like sales trends, product & category comparisons, layout optimisation, and staff performance, in a few clicks.
With the numbers on your side, you will never miss out on profit opportunities again.
This guide will walk you through the basic Back Office Reports, however, we also have a guide to help you explore Kounta Insights
Access Reports
The Back Office is accessible from any device and does not require a register profile. Anyone on your team who has been given Reports access can log in to view reports.
Note - Some reports will require the corresponding add-on to be enabled first.
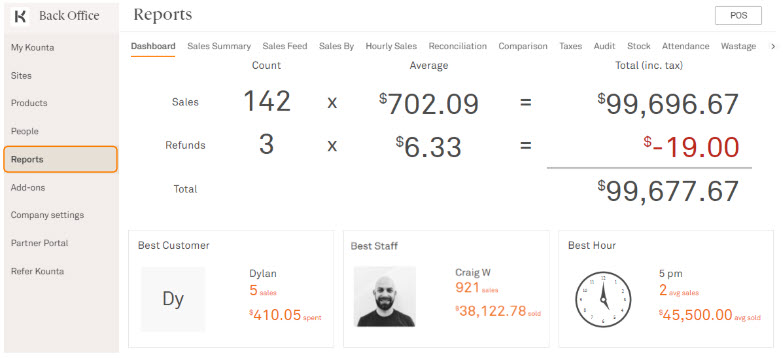
1. From the Kounta Back Office, select Reports
Pro Tip - Filter your reports for better detail by site, register, time, products, or tags - all depending on the report.
Dashboard
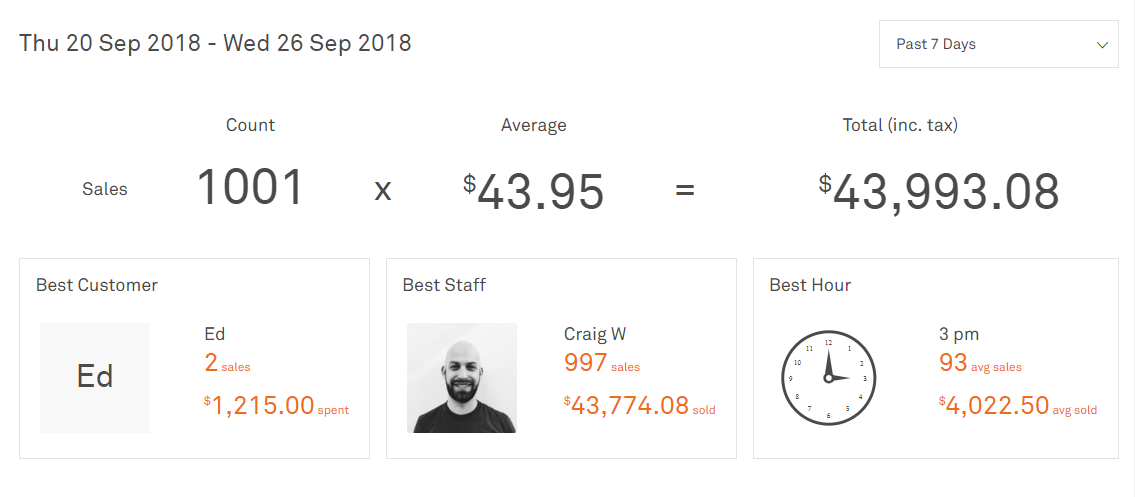
The dashboard is your home page - it will give you an overview of your business for today. This updates every 10 minutes. The summary version is found under Reports - but the detailed dashboard can be found by selecting My site. Here you will find:
Sales total
Best Customer, Best Staff, and Best Hour
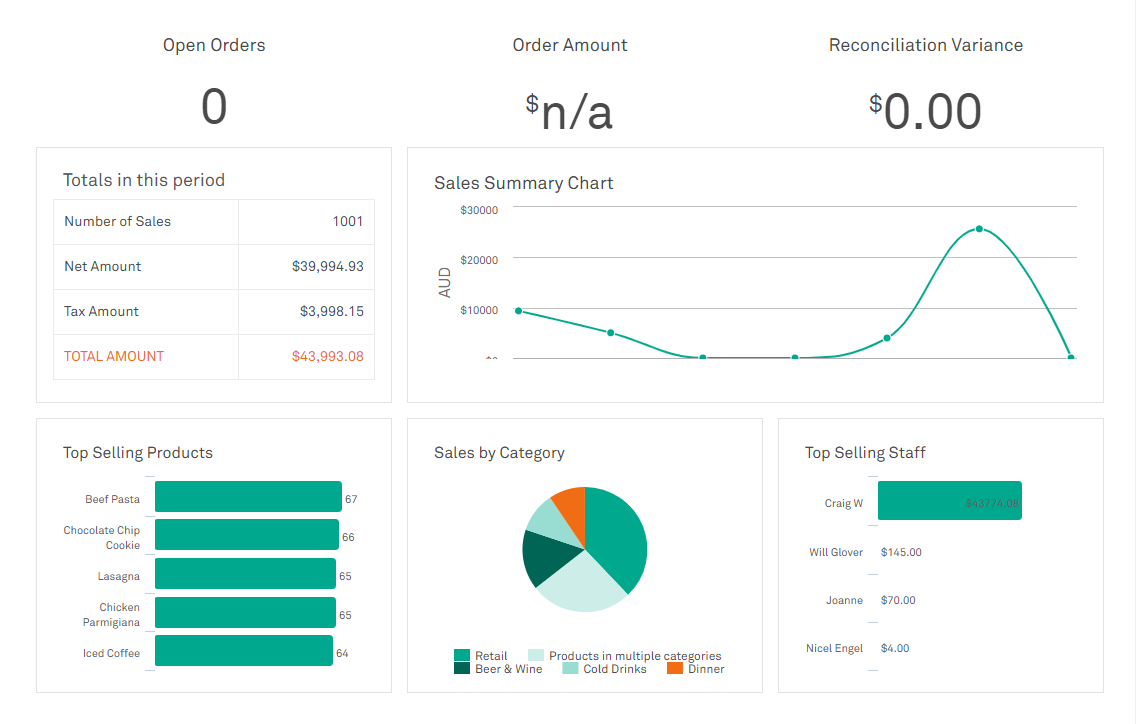
Sales Summary Chart
Top Selling Products
Sales by Category
Top Selling Staff
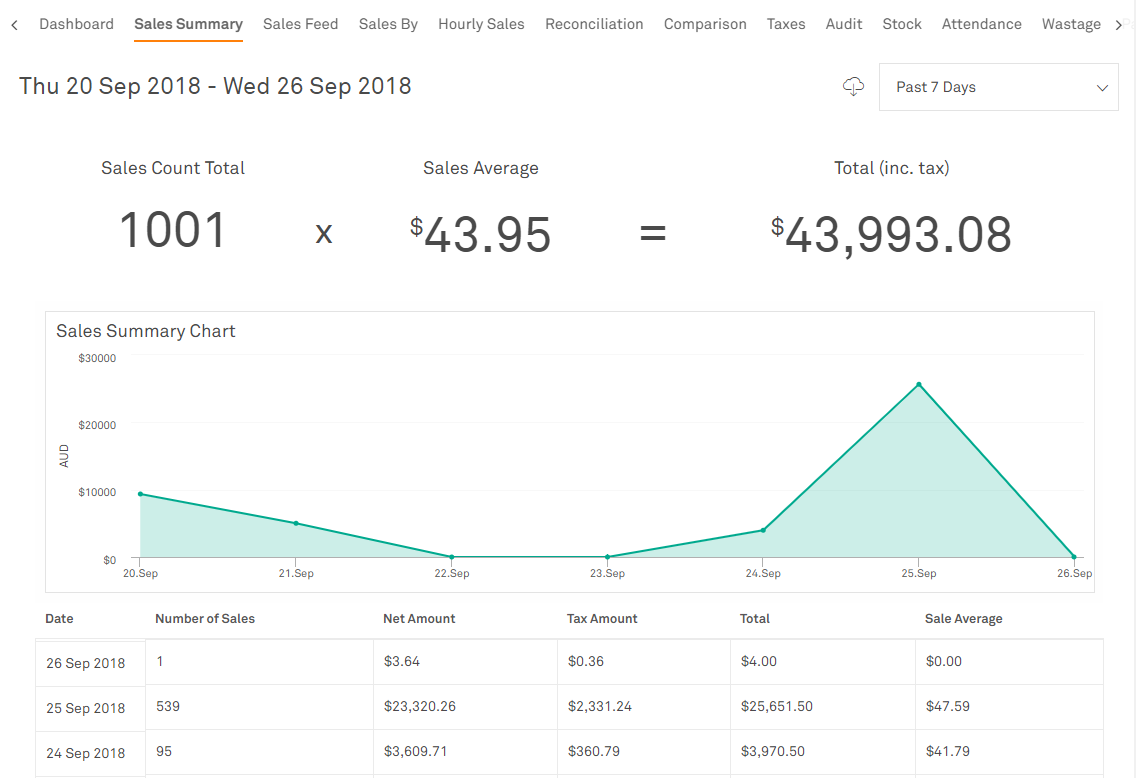
Sales Summary
The Sales Summary gives you a comprehensive view of sales including Number of Sales, Net Amount, Tax Amount, Total, and Sales Average which can be broken down by the day.
This updates every 10 minutes.
Note - This report *only* counts your sales in the form of gross output - it will not include refunds or returns.
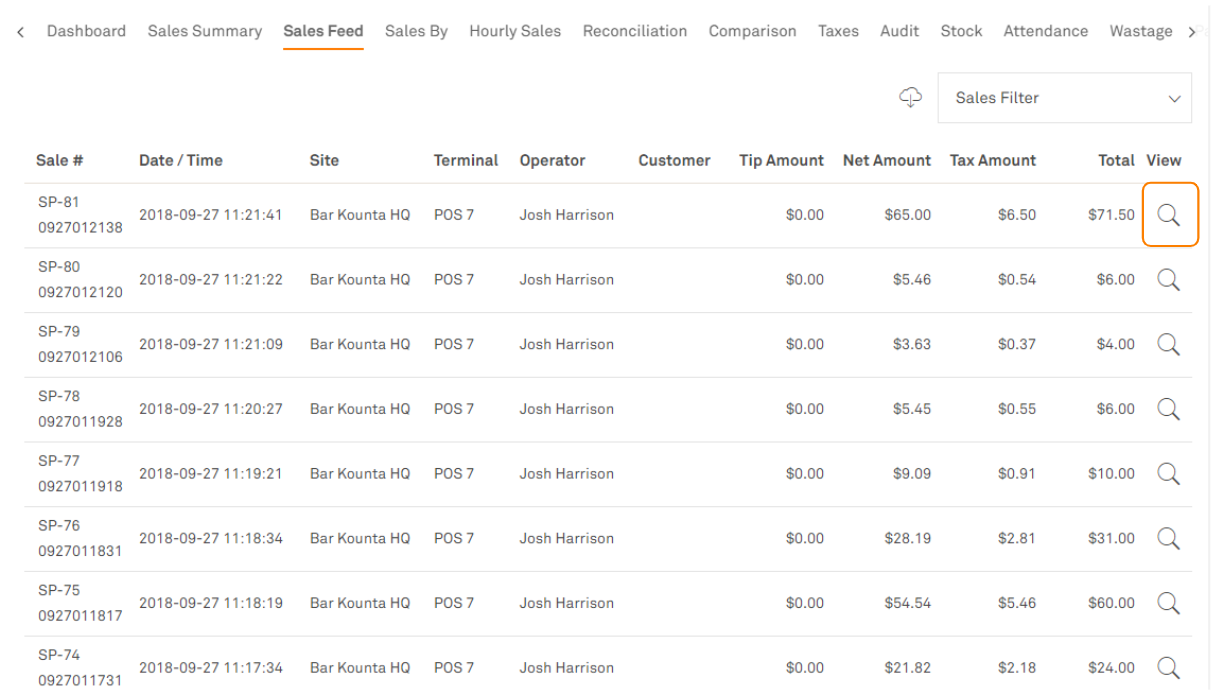
Sales Feed
This report updates live and is the reporting equivalent of your Sales History from the POS. You will also be able to quickly view and email customer receipts from here (simply select the magnifying glass icon).
The Sales Feed report is a raw export of your sales data - it shows the details of every sale ever made within a timeframe - including Sale #, Date/Time, Site, Customer, Tip Amount, and Total Amount. This report updates live - just select refresh.
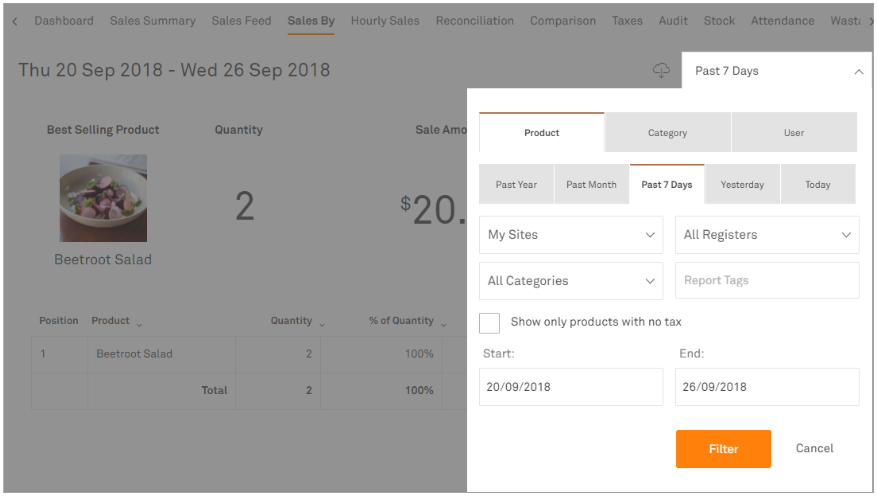
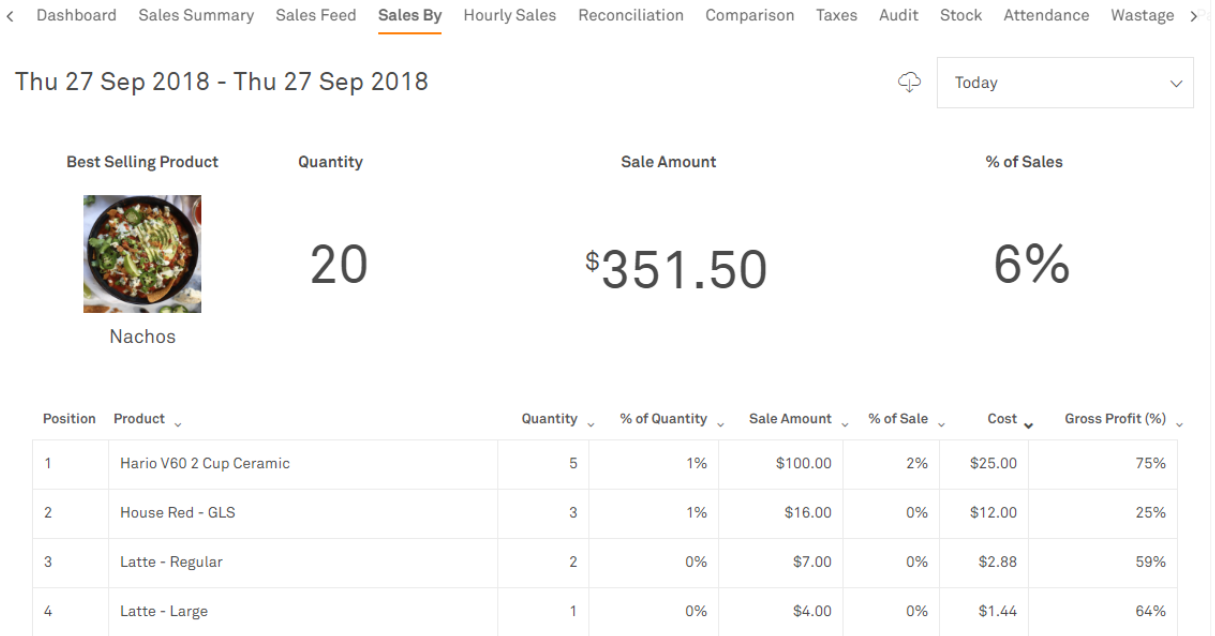
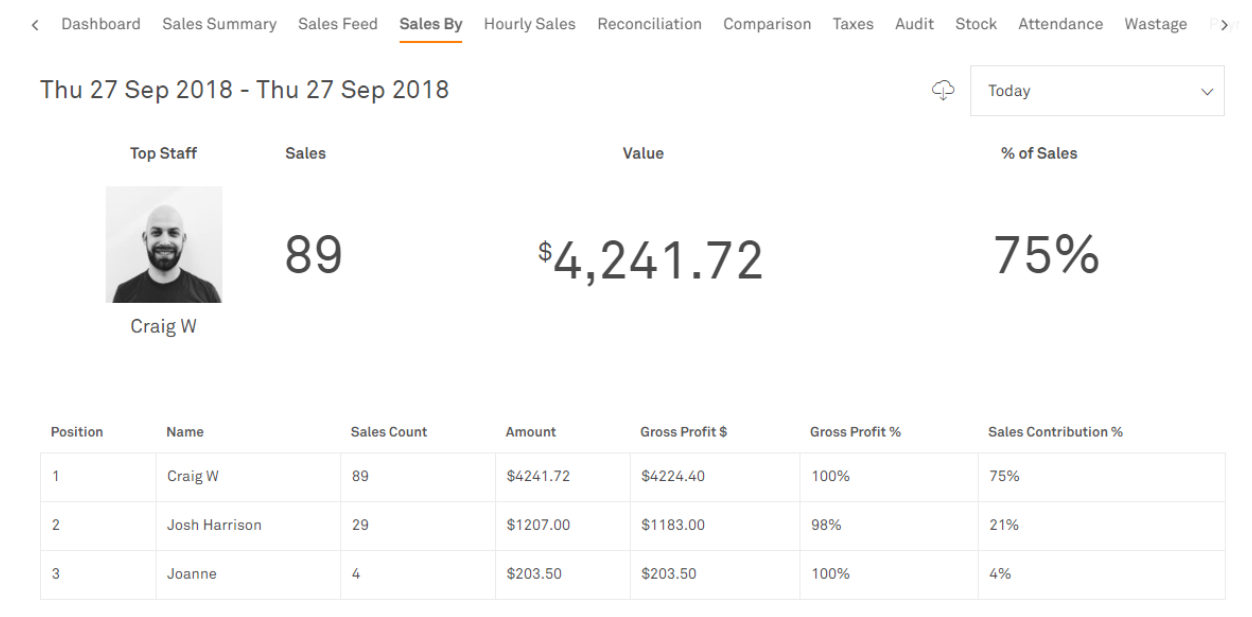
Sales By
Filter your sales numbers by the user, product, category, or even filtered by unique reporting tags… the list goes on. The Sales By report will not only give you a unique breakdown of your revenue, but will also show you your cost prices, and Gross Profit %. It updates every 10 minutes.
Snapshots for the top three filters used most regularly by our customers are shown below;
(Sales By) Product - Identify the best selling product and how products rank by quantity, sales amounts, cost, and gross profit %
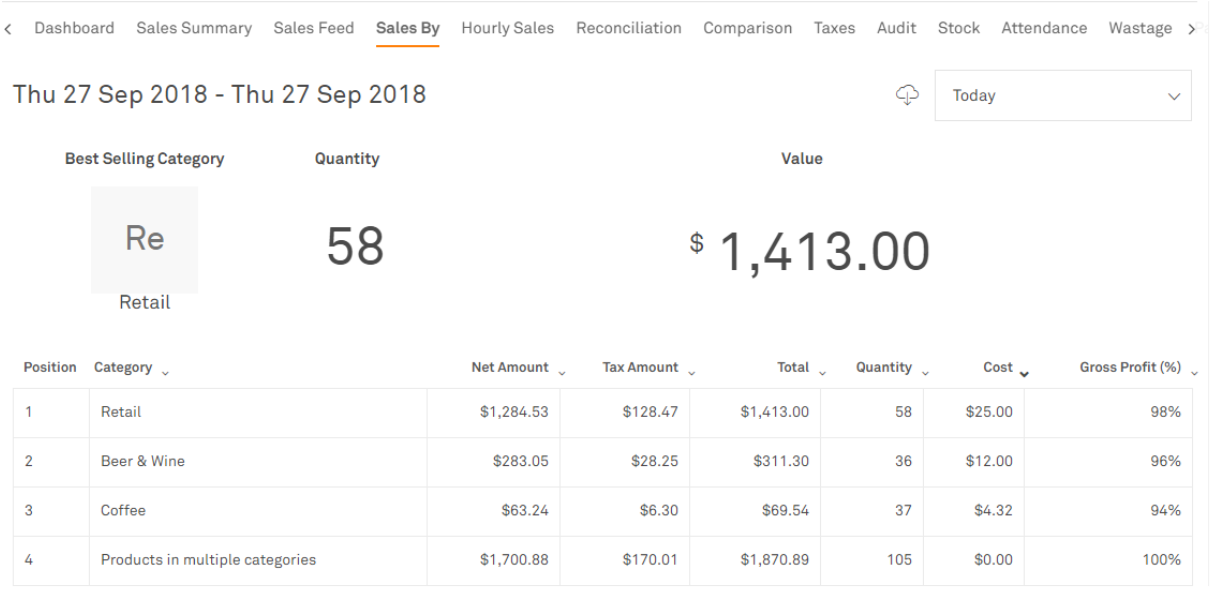
(Sales By) Category - Identify the best selling category and how categories rank by quantity, sales amounts, cost, and gross profit %.
Products in more than one category are merged into a “Products in Multiple Categories” field, and products in no categories are shown as “Products in No Category”
(Sales By) User - Identify your top staff and how your team rank in terms of sales contribution.
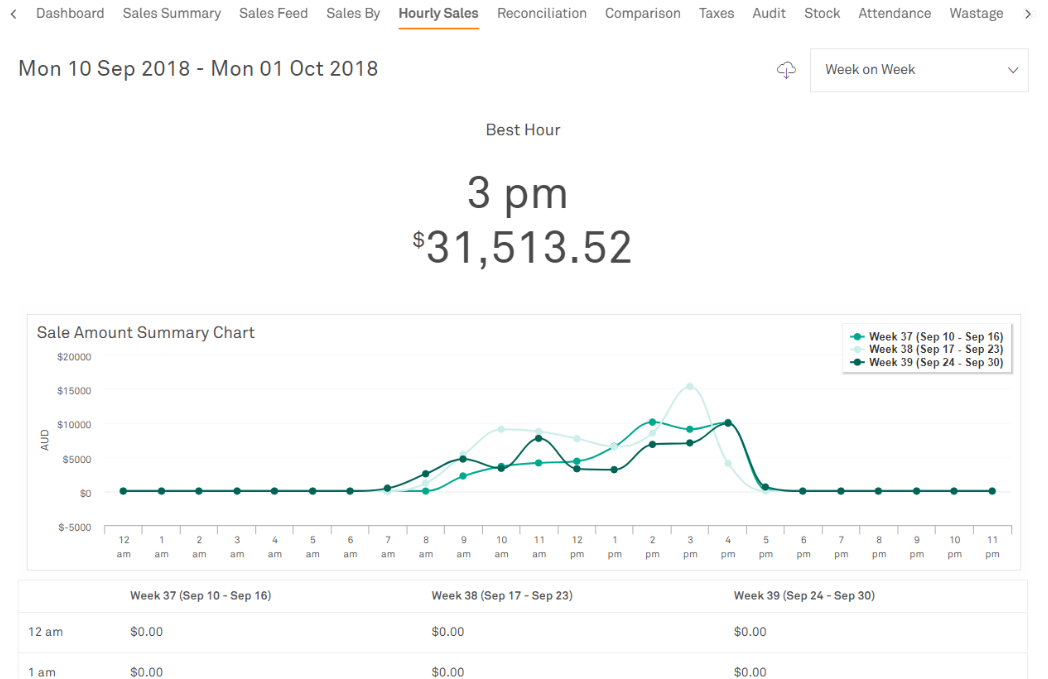
Hourly Sales
Was 3 pm really your busiest hour? Or did it just feel busier with everyone on break?
This report gives a perspective on how busy your business actually is so you can plan staffing and other resources to suit. This report updates every 10 minutes.
The top-level filters here are Sale Amount, Sale Count, Average Sale. You can view this as...
Summary Chart - hourly Sale Amount, Sale Count, or Sale Average
OR
Weekly Comparison - If you chose the week-on-week filter, you will see a comparison of sales performance per week
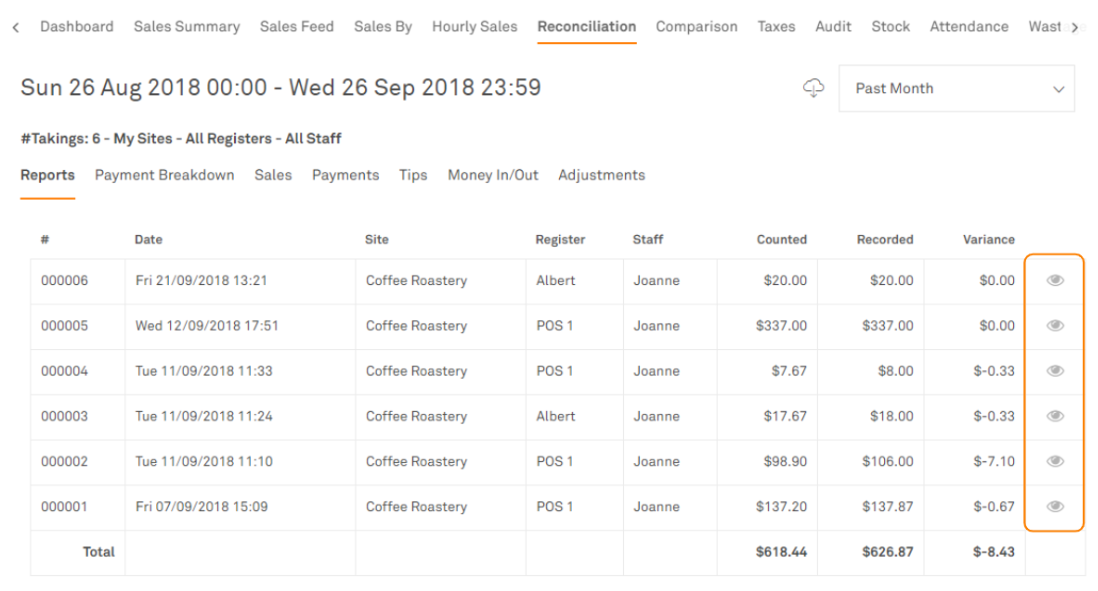
Reconciliation
The Reconciliation Report is a granular look into your takings. It consists of subreports which are as follows: Payment Breakdown, Sales, Payments, Tips, Money In/Out, and Adjustments.
Unlike the other reports that update regularly. This report only gets updated once the staff finalises takings and is, therefore, point-to-point. So if the staff forget to do takings for one day, the next end-of-day takings done would encompass the skipped day and the day itself.
Pro Tip - Integrate your accounting with Kounta to have this data sync’d seamlessly with your accounting package.
Here are the key subreports under Reconciliation:
A. Reports
Here, you will see an overview of all takings under your chosen filter.
Counted - The counted amount automatically counted with your integrated payment terminal (for card payments) or manually entered by your staff (for non-card payments)
Recorded - Total expected from all sales for the period, and inclusive of money ins and outs, and refunds.
Variance - The difference between Counted and Recorded
Pro Tip - Cash variances are common, however, we highly recommend familiarising your team with the correct takings process to ensure that this information is accurate each day so that you can quickly identify variances.
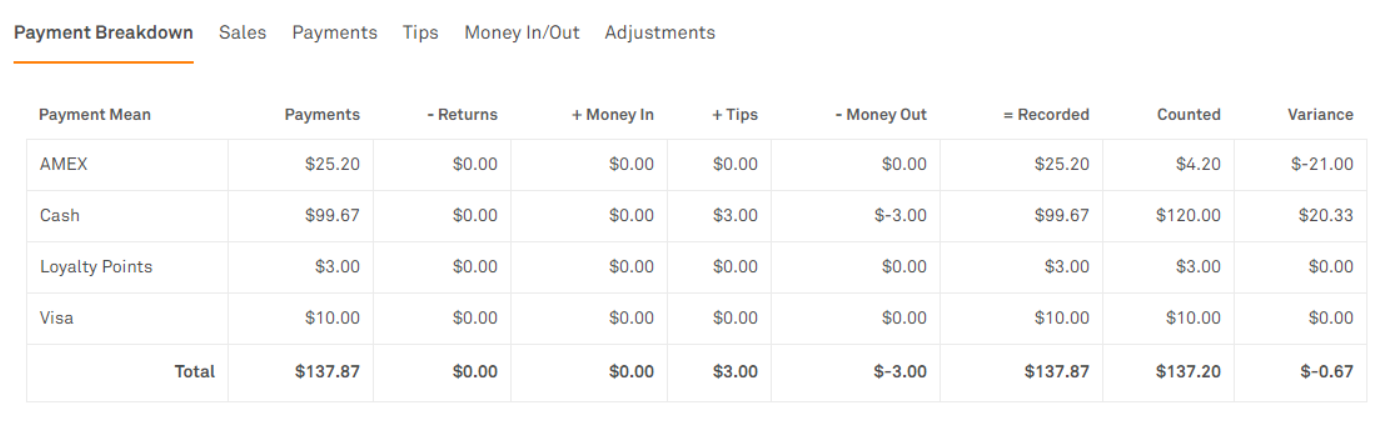
B. Payment Breakdown
As the name implies, this focuses on the payments methods within the chosen report. Under each payment method, you will see the payments, refunds, money in/out, and tips - all contributing to the recorded, counted, and variance amounts.
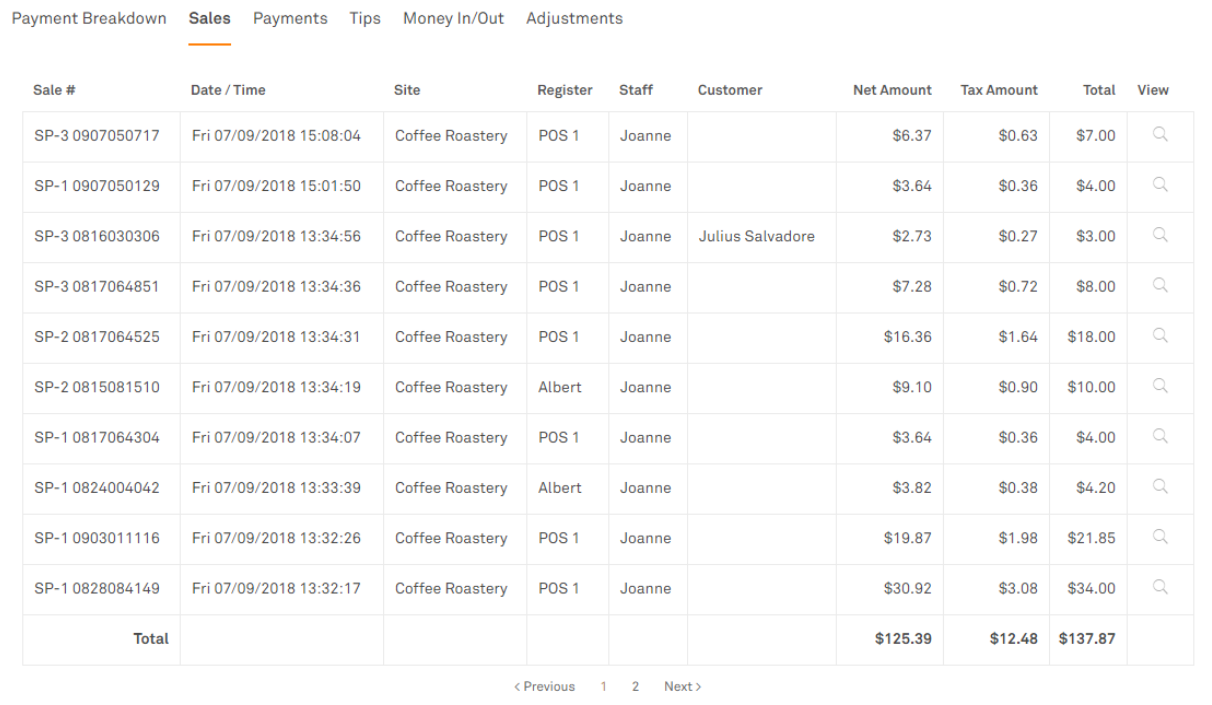
C. Sales
Similar to the Sales Feed, except this report will only show sales within the selected takings period. You can also view and email receipts by selecting the magnifying glass icon beside the sale record.
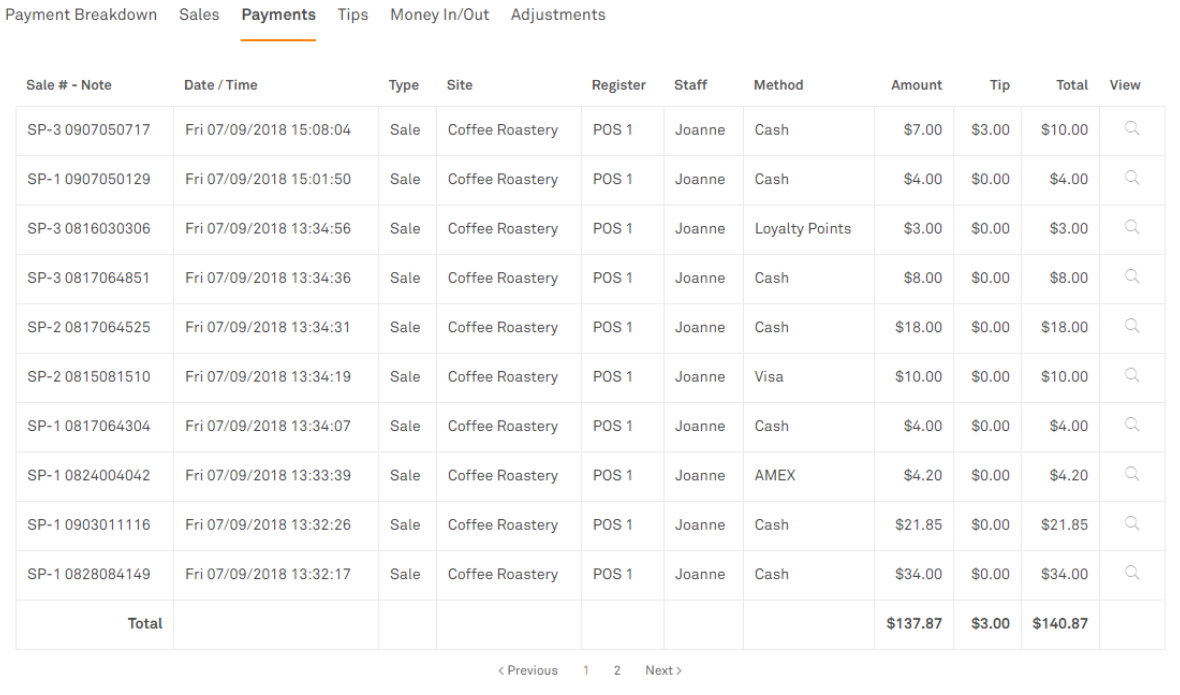
D. Payments
This is raw data on all payments made within a takings period including the gratuities.
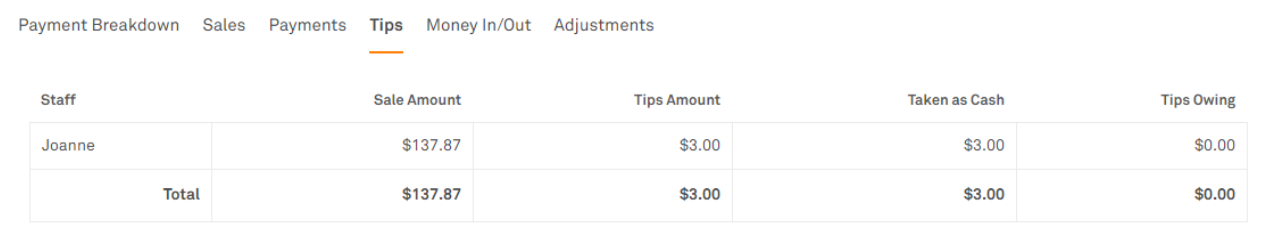
E. Tips
This is a summary of gratuities, to whom it’s going, and if it has been withdrawn as cash.
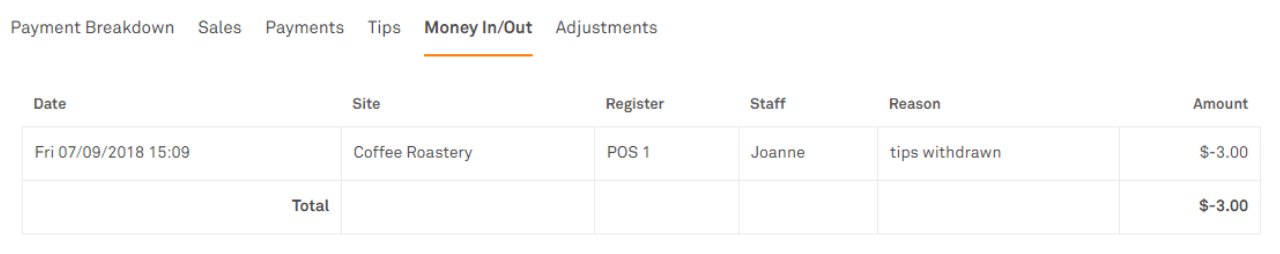
F. Money In/Out
This is a summary of float in/out as well as tips withdrawn from the cash drawer.
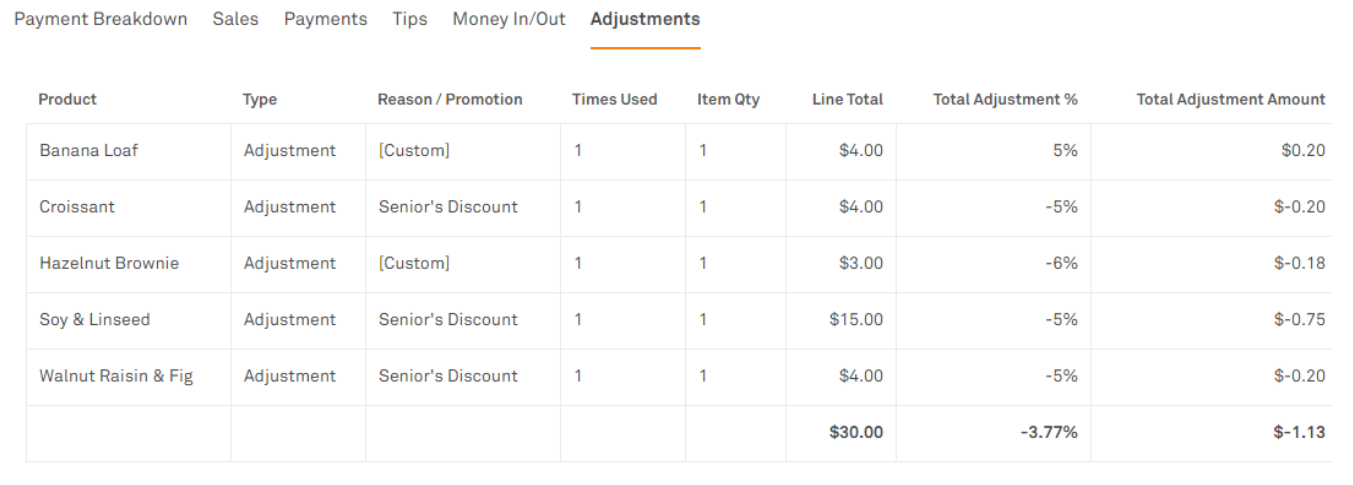
G. Adjustments
Here, you will find a summary of price adjustments, the reason behind the adjustment, and the products they were applied to.
Here, you will find a summary of price adjustments, the reason behind the adjustment, and the products they were applied to.
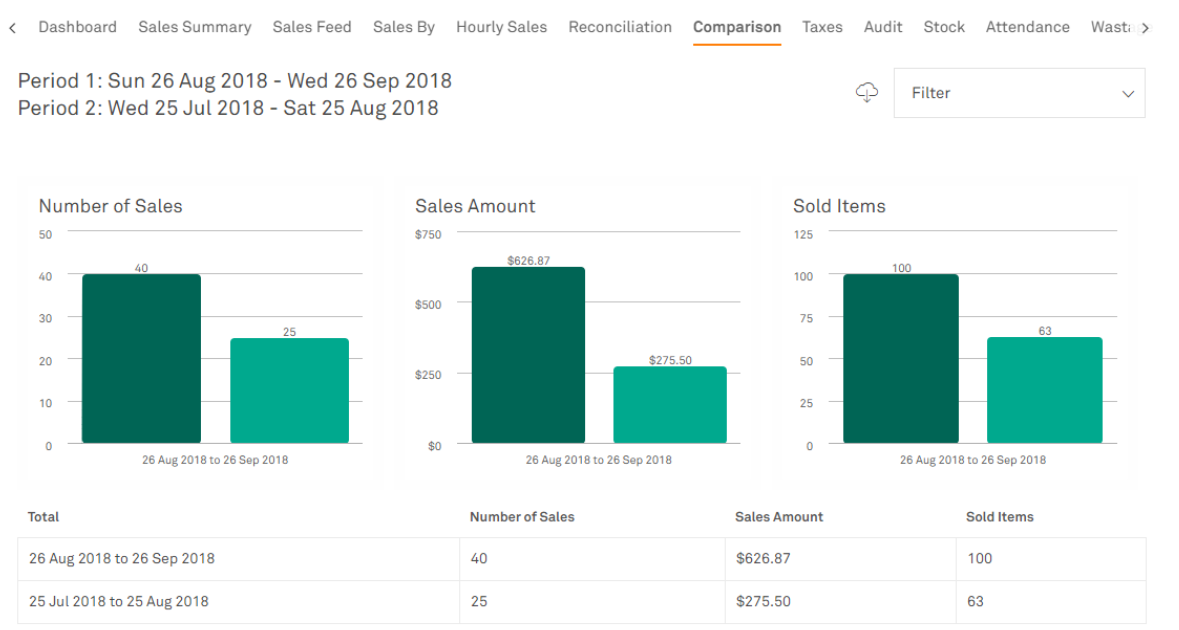
Comparison
This report allows you to build a comparison report between two chosen time periods. You can compare the number of sales, the sales amount, as well as how many items are sold.
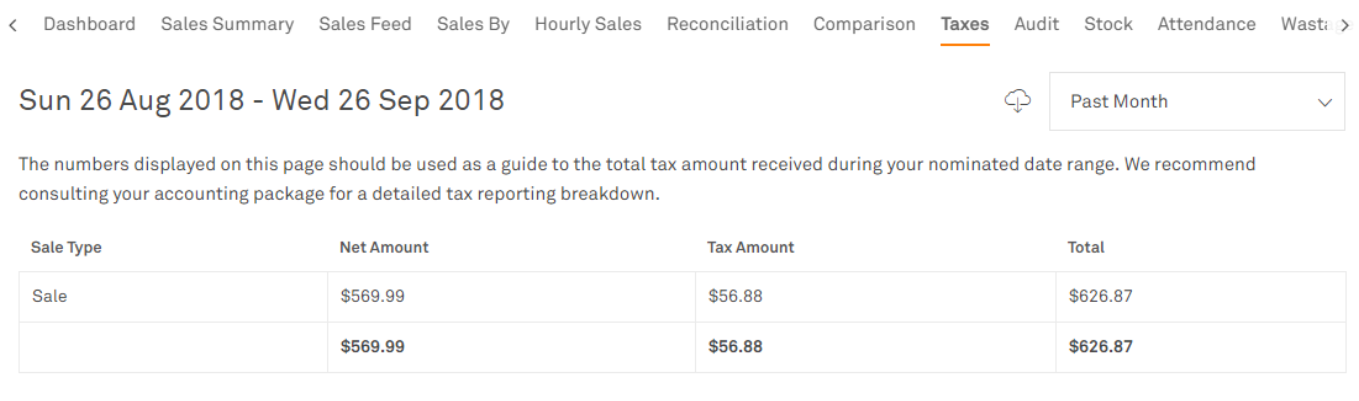
Taxes
The Taxes report will provide a simple breakdown of your taxable amounts based on your sales. The figures are rounded off to the nearest 2 decimal places.
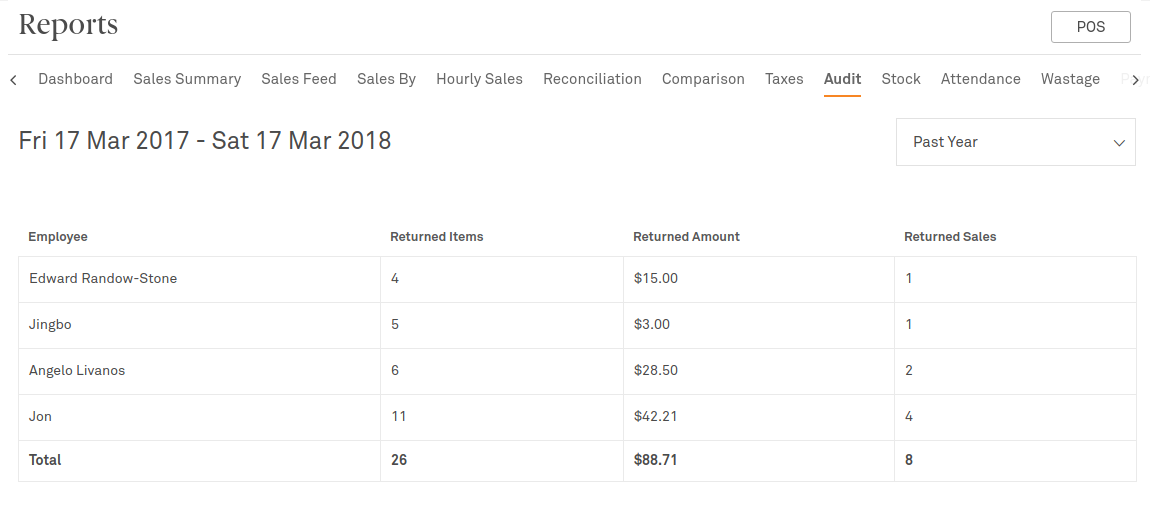
Audit
Quick, yet detailed reporting for auditing on all refunds and discounts entered by your team.
Track number of sales/products and also the lost revenue from each discount or refund to easily identify any excessive breaches of permissions.
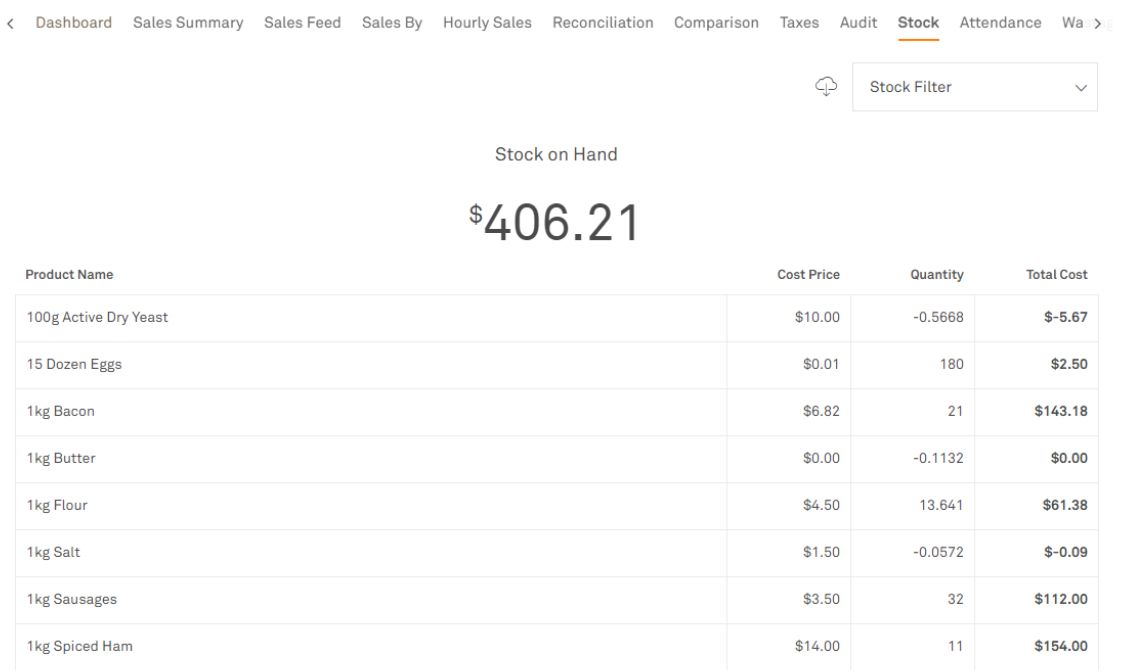
Stock
If you have the Inventory add-on enabled, the Stock report will give you a live count of all stock currently on hand and their cost.
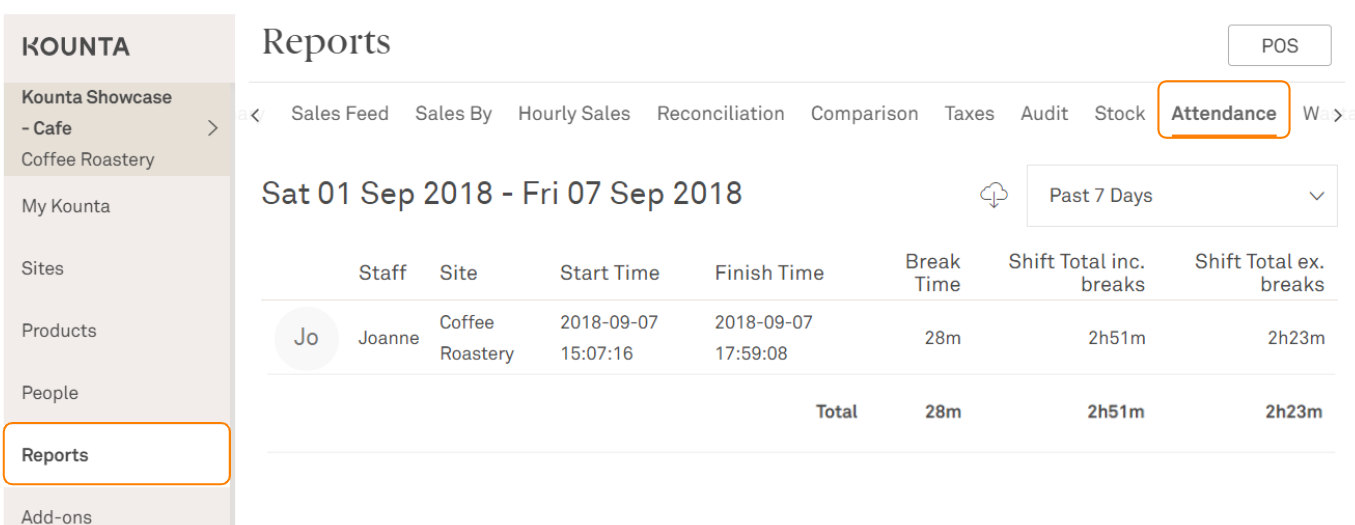
Attendance
If you have the Time & Attendance add-on enabled, this report will provide simple data based on when a user logs in or off from Kounta on a day to day basis.
You can also integrate your Time & Attendance data to Deputy, KeyPay, Tanda, or any of our other integration partners.
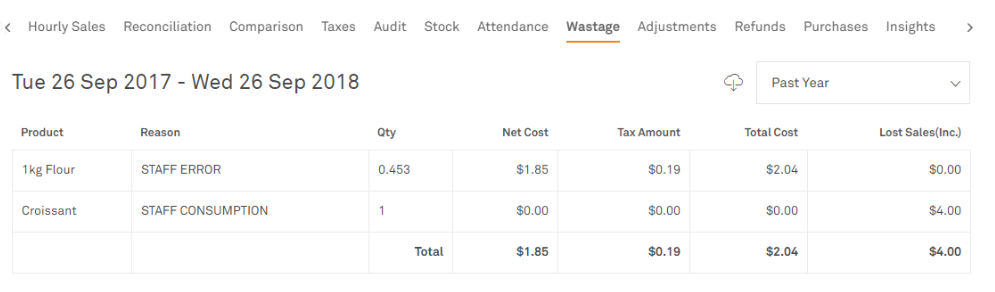
Wastage
Once you enable the Wastage add-on enabled, this report will provide a complete detail of all products or ingredients that were entered as wastage so you can track by wastage reasons, product type or lost revenue.
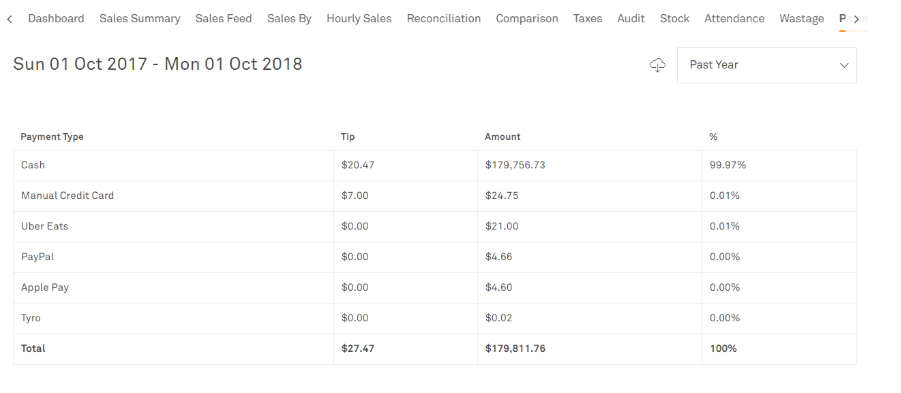
Payments
This report is only accessible if you have integrated payments. This is a summary of payments (similar to the Payments subreport under reconciliation). This report shows the total amount processed for each payment type and the percent this represents against your total revenue.
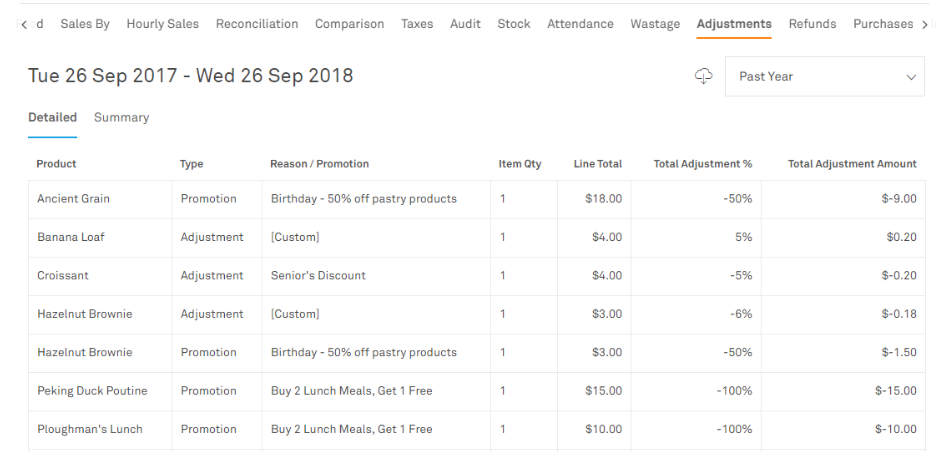
Adjustments
A detailed breakdown of all price adjustments, and promotions. View in either Summary or Detailed to see the reasons behind them, the products involved and the lost revenue.
A great report for seeing how well your promotions are performing.
Refunds
A summary of refund amounts and the reason behind the refund where you can filter by time, user, and reason.

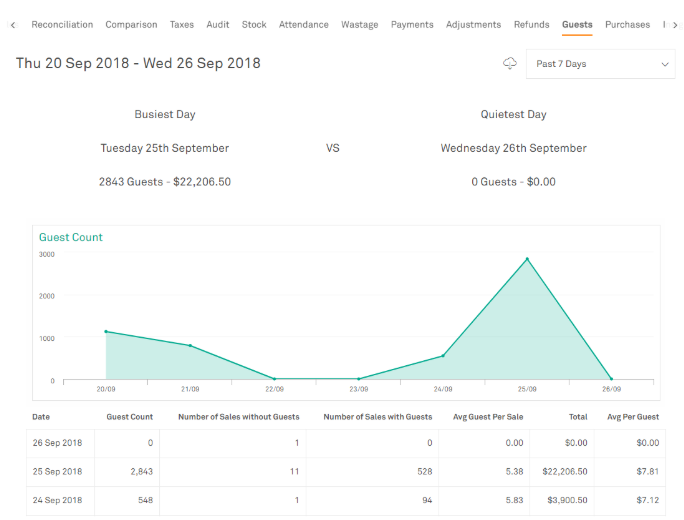
Guests
Enable the Guest Tracking Add-on and start reporting on average spend per head, or pair with the Tables add-on and track your dine in vs take away orders (Sales with Guests vs Sales without Guests).
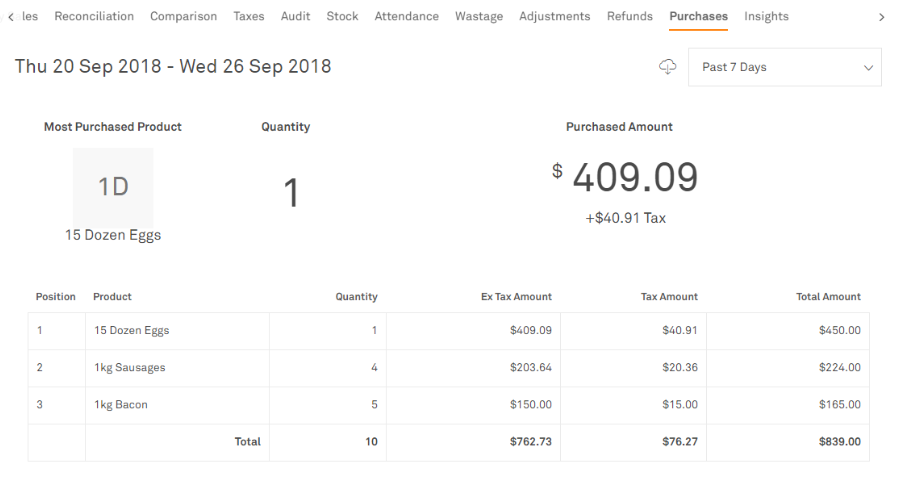
Purchases
For this report to be accessible, you would first need to subscribe to Kounta Purchase. With Kounta Purchase, getting stock into your business is simple, traceable, and connected to your inventory, reporting, and accounting systems for dreamlike efficiency.
The purchases report will show you your total received or drafted purchase orders for any given period, and filter based on specific products, categories or supplier.
Related Articles
Enabling Refund Reasons
Refunds can happen for many reasons in a hospitality business. Instead of only tracking how many refunds occur, it can be useful to understand why they happen. Knowing the reasons behind refunds can help you identify operational issues, staff ...How to Track Staff Breaks in Abacus POS
Currently, Abacus POS does not have a dedicated feature to track staff break times. As a workaround, you can manually track breaks by asking staff members to clock out when they start their break and clock in again when they return. Example If a ...Processing Refunds in Chewzie Online Ordering
If you need to refund an order placed through Chewzie, the refund should be processed directly from the Chewzie back office. This ensures the transaction is handled properly and recorded correctly in the system. Payments for Chewzie orders are ...Tracking Wastage
Staff error, food sent back to the kitchen, expired ingredients, missing stock items, unsold inventory - there are various reasons why wastage happens. The first step to managing wastage is to know the full story. Empower your staff to record how ...Schedule an Automatic Sales Report via Email
If you’d like to receive a daily summary of your sales via email, you can schedule a sales report directly from the POS back office. This allows you to review your daily performance without needing to manually generate the report each time. Follow ...